Graphical Visualization for Understanding the f1-score

by Martin Monperrus
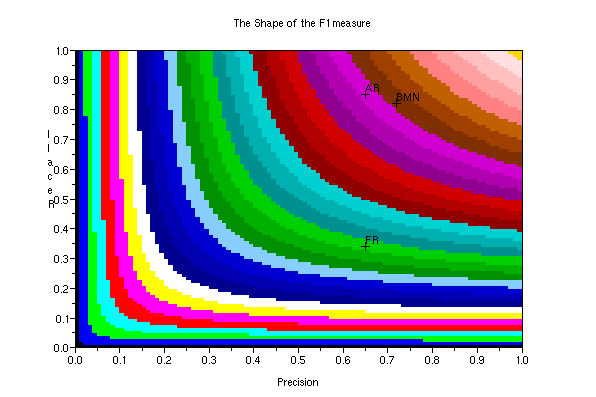
F1 is a standard evaluation metric from information retrieval research. It combines the precision and the recall. In order to understand this combination, here is a visualization of the landscape of the F1-score. A perfect system (with precision and recall ~ 100%) would be on the top right hand side of the figure.

There are points denoting the performance of three systems AR, FR and BMN. For instance the FR has system has a precision of 65% and a recall of 85%. According to the F1-score:
* even if BMN is very close to AR it has a better F1.
* even if FR has the same precision as AR, its F1 score (green zone) is far from the magenta zone of AR.

f-score f-measure f1
Tagged as: