I’ve just read “A systematic review of effect size in software engineering experiments” (IST, 2007).
The authors say that in software engineering, an effect size is considered as:
- small if Cohen’s d is approx. 0.17
- medium if Cohen’s d is approx. 0.60
- large if Cohen’s d is approx. 1.40
What does this mean? Let’s have a graphical view on Cohen’s d Effect Size to get the intuition. We plot to Gaussian distributions corresponding to a given effect size.
Cohen’s d effect size of = 0.17 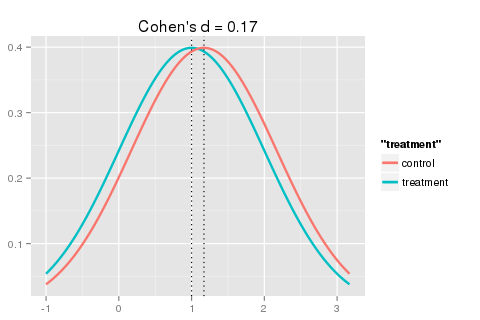
Cohen’s d effect size of = 0.60 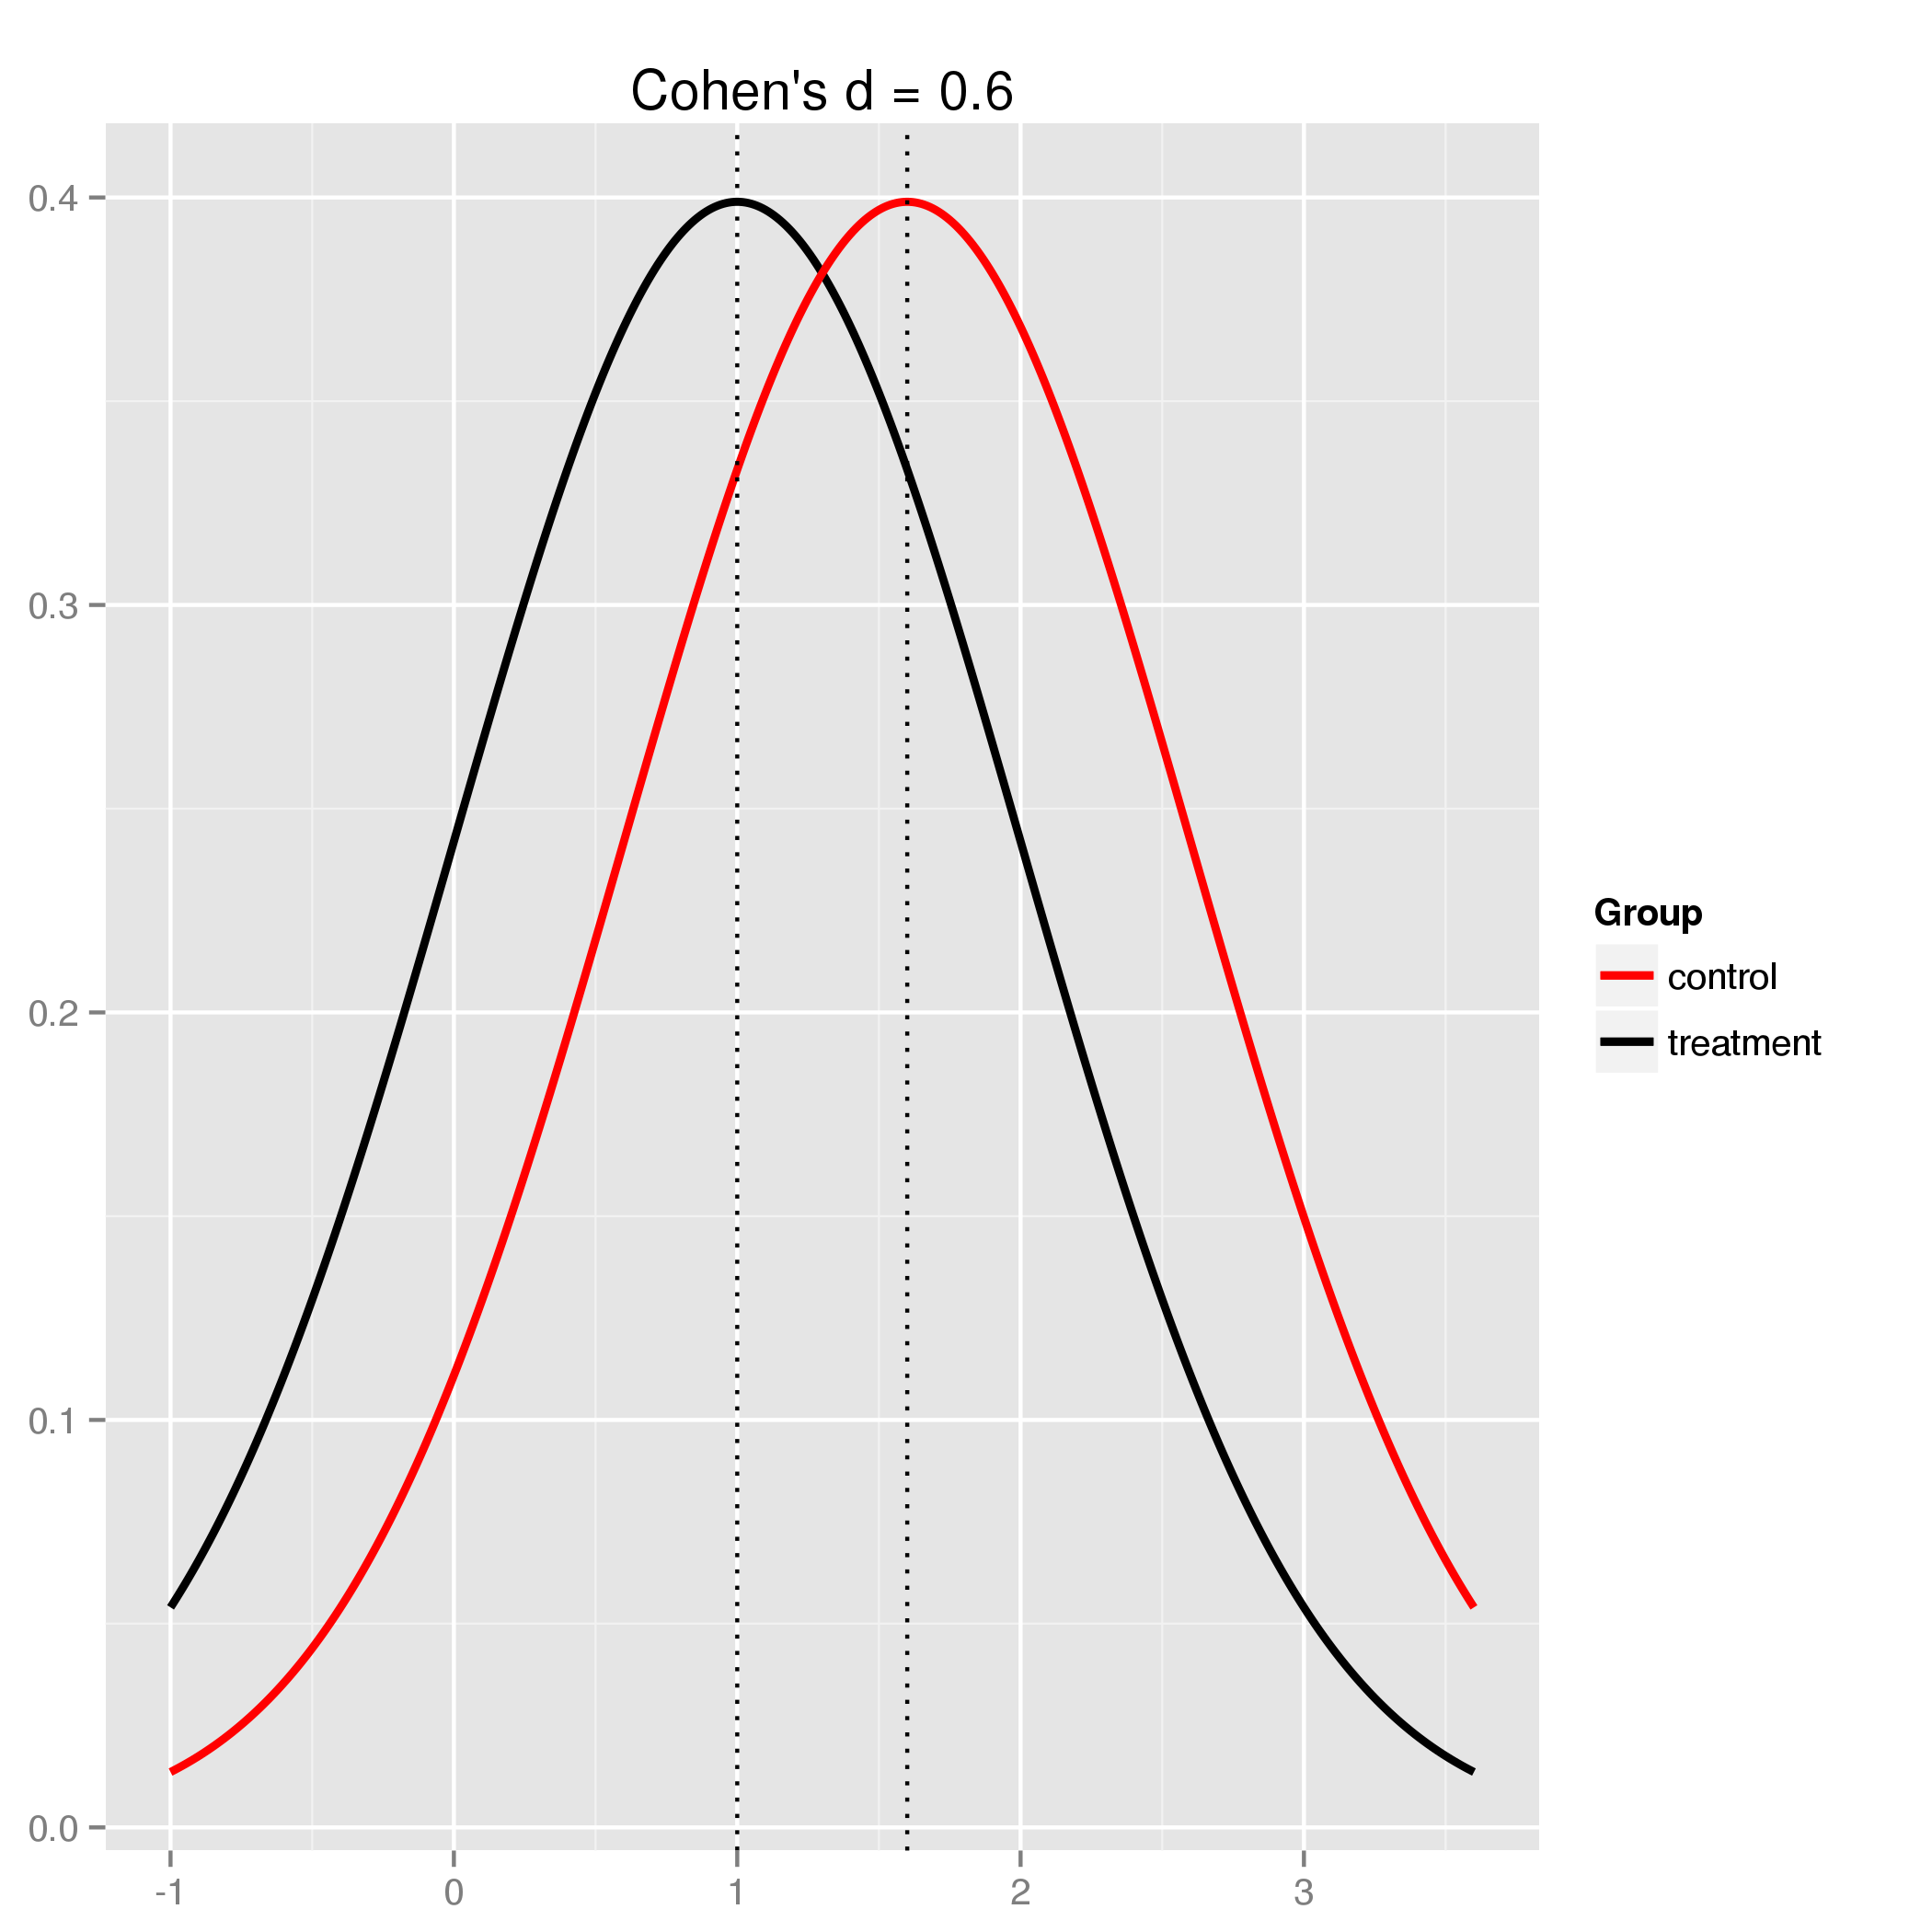
Cohen’s d effect size of = 1.4 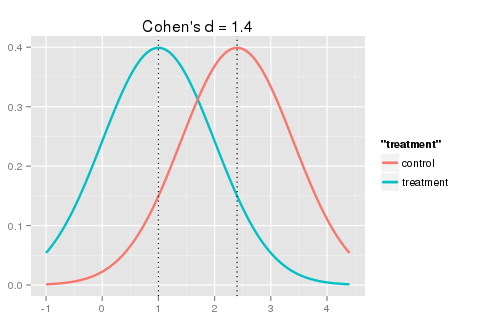
Cohen’s d effect size of = 0.05 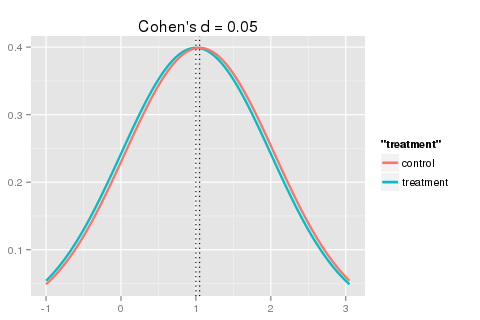
Done with gist 86ece0cc remixed from http://rpsychologist.com/short-r-script-to-plot-effect-sizes-cohens-d-and-shade-overlapping-area